Loading Insight...

Insights
Insights

5-min read • 7 Mar 2022
Data
Innovation
Digital
General
APAC
Data Visualisation Management: A Picture is Worth More Than a Thousand Words
In this article, we explore data visualisation as part of our series of articles. It is the third of the seven components within our DATAMANAGEMENTINABOXTM solution, a framework that supports our clients in setting up and incorporating control and monitoring into their organisation for data to be used consistently and effectively.
Every day, quintillion bytes of data are collected, produced, and processed. To put that into perspective, a quintillion has 18 zeros, and this number continues to increase every single day. The growing amount of data circulating worldwide has unleashed unfathomable potential when it comes to improving business processes, enabling key strategic initiatives, and even improving relationships with customers and business partners.
With the vast quantity of data that financial institutions have access to, it is crucial, now more than ever, for them to fully maximise the usage of data that are relevant to their organisations to stay ahead of the game. However, data usually arrive in tabular or raw format, with hundreds of thousands of different numbers and texts that would not make sense to most people. This becomes an obstacle for institutions to efficiently understand the data, and as a result, the information conveyed in the data is often moved out uninterpreted.
This is where data visualisation plays a critical role.
Data visualisation works by translating the sheer amount of data into graphical representations, which gives data a universal paint, allowing both data and non-data experts to have the same understanding. Instead of presenting data in the conventional form of tables, transforming them into charts and graphs will display a clearer picture to detect patterns, structures, trends, clusters, and outliers. This, in turn, will enable management to see how the organisation is performing and make better decisions.
The impact of data visualisation on business
As one of the essential steps in the business intelligence process, data visualisation transforms raw data to extract key findings from a massive amount of data. The impact on the business can be significant if a data visualisation with poor quality is conducted.
On the other hand, if done right, data visualisation can bring about countless benefits, such as:
Instant absorption of large and complex data
Data visualisation applies visuals to communicate information in a clear and efficient manner. The transformation of raw data into graphical presentations makes it easy for stakeholders to identify the critical findings derived from the data.
Businesses can easily recognise patterns quickly, allowing stakeholders in different capacities of decision-making to mutually determine the most likely routes for success and pinpoint the most efficient means for taking ideas forward.
Better comprehension of information
Visualised data presents a comprehensive summary to stakeholders, business owners, and decision-makers, positively impacting an organisation’s decision-making process with interactive visual representations of data.
For instance, the product team can address the customers’ preferences on each product and explore potential enhancements of their strategies. At the same time, business owners or business analysts can reveal hidden patterns and draw deeper insight from the data to make better business decisions on their strategies and offerings, which leads to our next benefit.
Better decision-making based on data
It is important that the visualisation used in a presentation is supported by data that is the most relevant and befitting to the body of information in question. With a sound course of action derived from a clearly presented and visualised data set, analysts and decision-makers can quickly put the insights they glean into action, with greater confidence that the next step will lead to a successful outcome.
Connecting business with operational activities
As the business landscape grows increasingly competitive each year, the correlation between market performance and operating conditions can play a significant role in maintaining high profitability and outstanding operational efficiency. Data visualisation allows business analysts to simultaneously see multiple dimensions of information and how it all interrelates.
Data visualisation management, key to better understanding and better decision-making
With the treasure trove of data that financial institutions have access to, to not leveraged the data to better understand their standings would be a waste. But to utilise the data, visualisation is the key to maximising the information conveyed in their data.
The Synpulse DATAMANAGEMENTINABOX™ solution offers a data visualisation framework, which guides financial institutions in painting their data in a visual representation. The design of the toolbox supports them in structuring and customising their data visualisation report in a way that best suits their needs.
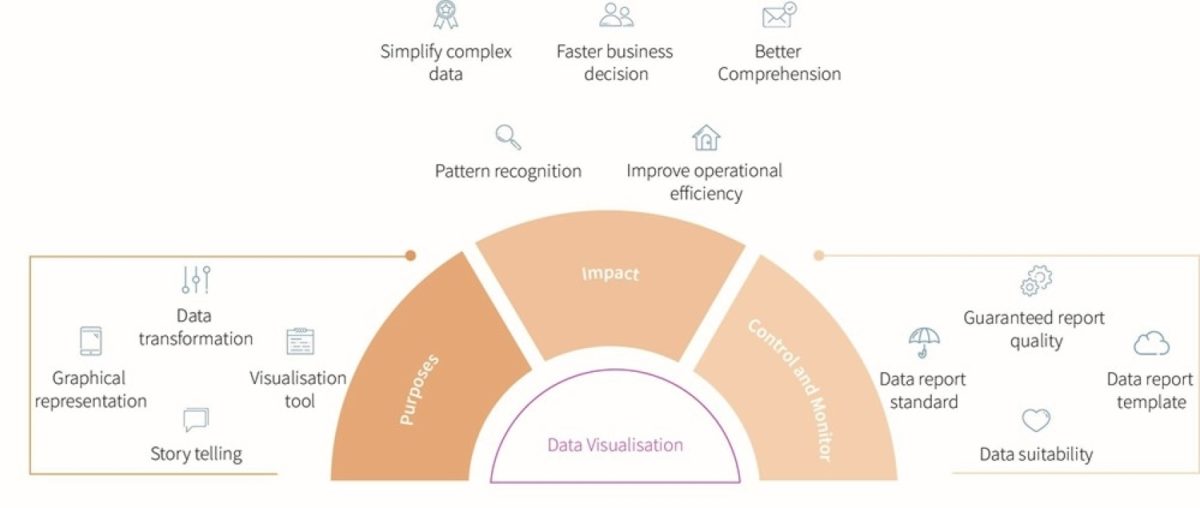
Figure 1. Data visualisation framework
Data visualisation control
The aim of data visualisation control is to ensure that the appropriate visualisation report or dashboard is produced. In generating a report, multiple factors must be considered. For example, different characteristics of data and business requirements require its own set of logic for visualisation. Depending on the characteristics, certain tools or graphs may be more suitable than others. This must be agreed upon between the developers and the stakeholders or business users.
The control framework provides a set of assessment criteria for the whole data report development lifecycle from concept to implementation. It guides the client in capturing the business needs with their data source suitability. The toolbox then helps identify the correct data visualisation tools to use, the source and preprocessing of data to suit the implementation, and the set of charts to display within the report.
Data visualisation monitoring
Our data visualisation monitoring framework provides sufficient support for financial institutions to sustain a high-quality data visualisation report. A data report catalogue that describes all reports in the company is well-established in our framework, and it documents all the fundamental information of individual graphs and charts. The objective here is to ensure that the appropriate data illustrated in a report is well recorded and maintained.
Whenever a business analyst or database architect is requested to build a new data report, the data report catalogue can serve as a reference, which minimises the time and redundancy of investigating the most suitable infographics and charts. Our monitoring framework addresses the most necessary data elements and reports requirements, advising our clients to maintain an extensive visual report with precise graphs and charts.
What’s next?
With DATAMANAGEMENTINABOX™, we consolidate our deep data expertise and hands-on industry experience to provide a solid reference model for all financial institutions to solve their data management struggles.
This article introduces our Data Visualisation Management framework as the third of the seven components within our DATAMANAGEMENTINABOX solution. We will be introducing each of the components in the coming months, so stay tuned.
The growing importance of data has placed an increased emphasis and awareness on data management in financial institutions. With the vast volume of customer and market data collected every day, financial institutions need to ensure a high reusability across the organisation to maximise the value of data, all while minimising the re-collection and re-formatting efforts.
In an effort to engage with clients in the wave of digital transformation, financial institutions have been establishing omni-channels that collect a vast quantity of new market and customer data. The information is contained in the form of trillions of structured and unstructured fragments and is stored in physical or cloud databases, waiting for business owners to crack the code for successful insights.
Related Contents
Loading insights...

5-min read • 7 Mar 2022
Data
Innovation
Digital
General
APAC
Data Visualisation Management: A Picture is Worth More Than a Thousand Words
In this article, we explore data visualisation as part of our series of articles. It is the third of the seven components within our DATAMANAGEMENTINABOXTM solution, a framework that supports our clients in setting up and incorporating control and monitoring into their organisation for data to be used consistently and effectively.
Every day, quintillion bytes of data are collected, produced, and processed. To put that into perspective, a quintillion has 18 zeros, and this number continues to increase every single day. The growing amount of data circulating worldwide has unleashed unfathomable potential when it comes to improving business processes, enabling key strategic initiatives, and even improving relationships with customers and business partners.
With the vast quantity of data that financial institutions have access to, it is crucial, now more than ever, for them to fully maximise the usage of data that are relevant to their organisations to stay ahead of the game. However, data usually arrive in tabular or raw format, with hundreds of thousands of different numbers and texts that would not make sense to most people. This becomes an obstacle for institutions to efficiently understand the data, and as a result, the information conveyed in the data is often moved out uninterpreted.
This is where data visualisation plays a critical role.
Data visualisation works by translating the sheer amount of data into graphical representations, which gives data a universal paint, allowing both data and non-data experts to have the same understanding. Instead of presenting data in the conventional form of tables, transforming them into charts and graphs will display a clearer picture to detect patterns, structures, trends, clusters, and outliers. This, in turn, will enable management to see how the organisation is performing and make better decisions.
The impact of data visualisation on business
As one of the essential steps in the business intelligence process, data visualisation transforms raw data to extract key findings from a massive amount of data. The impact on the business can be significant if a data visualisation with poor quality is conducted.
On the other hand, if done right, data visualisation can bring about countless benefits, such as:
Instant absorption of large and complex data
Data visualisation applies visuals to communicate information in a clear and efficient manner. The transformation of raw data into graphical presentations makes it easy for stakeholders to identify the critical findings derived from the data.
Businesses can easily recognise patterns quickly, allowing stakeholders in different capacities of decision-making to mutually determine the most likely routes for success and pinpoint the most efficient means for taking ideas forward.
Better comprehension of information
Visualised data presents a comprehensive summary to stakeholders, business owners, and decision-makers, positively impacting an organisation’s decision-making process with interactive visual representations of data.
For instance, the product team can address the customers’ preferences on each product and explore potential enhancements of their strategies. At the same time, business owners or business analysts can reveal hidden patterns and draw deeper insight from the data to make better business decisions on their strategies and offerings, which leads to our next benefit.
Better decision-making based on data
It is important that the visualisation used in a presentation is supported by data that is the most relevant and befitting to the body of information in question. With a sound course of action derived from a clearly presented and visualised data set, analysts and decision-makers can quickly put the insights they glean into action, with greater confidence that the next step will lead to a successful outcome.
Connecting business with operational activities
As the business landscape grows increasingly competitive each year, the correlation between market performance and operating conditions can play a significant role in maintaining high profitability and outstanding operational efficiency. Data visualisation allows business analysts to simultaneously see multiple dimensions of information and how it all interrelates.
Data visualisation management, key to better understanding and better decision-making
With the treasure trove of data that financial institutions have access to, to not leveraged the data to better understand their standings would be a waste. But to utilise the data, visualisation is the key to maximising the information conveyed in their data.
The Synpulse DATAMANAGEMENTINABOX™ solution offers a data visualisation framework, which guides financial institutions in painting their data in a visual representation. The design of the toolbox supports them in structuring and customising their data visualisation report in a way that best suits their needs.
Figure 1. Data visualisation framework
Data visualisation control
The aim of data visualisation control is to ensure that the appropriate visualisation report or dashboard is produced. In generating a report, multiple factors must be considered. For example, different characteristics of data and business requirements require its own set of logic for visualisation. Depending on the characteristics, certain tools or graphs may be more suitable than others. This must be agreed upon between the developers and the stakeholders or business users.
The control framework provides a set of assessment criteria for the whole data report development lifecycle from concept to implementation. It guides the client in capturing the business needs with their data source suitability. The toolbox then helps identify the correct data visualisation tools to use, the source and preprocessing of data to suit the implementation, and the set of charts to display within the report.
Data visualisation monitoring
Our data visualisation monitoring framework provides sufficient support for financial institutions to sustain a high-quality data visualisation report. A data report catalogue that describes all reports in the company is well-established in our framework, and it documents all the fundamental information of individual graphs and charts. The objective here is to ensure that the appropriate data illustrated in a report is well recorded and maintained.
Whenever a business analyst or database architect is requested to build a new data report, the data report catalogue can serve as a reference, which minimises the time and redundancy of investigating the most suitable infographics and charts. Our monitoring framework addresses the most necessary data elements and reports requirements, advising our clients to maintain an extensive visual report with precise graphs and charts.
What’s next?
With DATAMANAGEMENTINABOX™, we consolidate our deep data expertise and hands-on industry experience to provide a solid reference model for all financial institutions to solve their data management struggles.
This article introduces our Data Visualisation Management framework as the third of the seven components within our DATAMANAGEMENTINABOX solution. We will be introducing each of the components in the coming months, so stay tuned.
The growing importance of data has placed an increased emphasis and awareness on data management in financial institutions. With the vast volume of customer and market data collected every day, financial institutions need to ensure a high reusability across the organisation to maximise the value of data, all while minimising the re-collection and re-formatting efforts.
In an effort to engage with clients in the wave of digital transformation, financial institutions have been establishing omni-channels that collect a vast quantity of new market and customer data. The information is contained in the form of trillions of structured and unstructured fragments and is stored in physical or cloud databases, waiting for business owners to crack the code for successful insights.