According to a recent study done in 2021, 90% of financial institutions (FIs) say that they are under pressure to utilise analytics and data-driven capabilities as they have realised that data-driven decision-making is key to the business. However, fewer than half of FIs are able to base their decisions on their data.
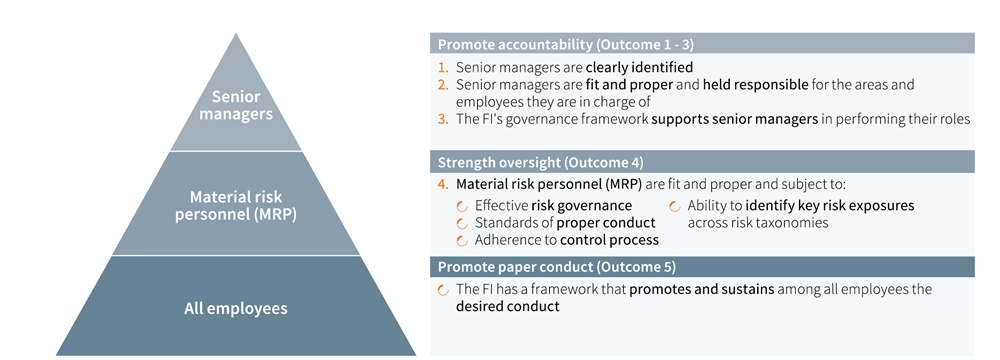
On top of that, similar to the Hong Kong Monetary Authority’s (HKMA) Supervision for Bank Culture1, the Individual Accountability and Conduct (IAC) guidelines2 rolled out by the Monetary Authority of Singapore (MAS) became effective on September 2021. The guidelines aim to increase the level of accountability of senior managers and advocated policies and processes at FIs to embed risk ownership at all levels of the organisation.
FIs are required to achieve the five outcomes shown in Figure 1 regarding senior managers, material risk personnel and all employees. This creates additional stress in addition to the complex labyrinth of regulations that FIs must satisfy. In particular, outcome 4 – Strengthening Oversight – calls for FIs to establish a stronger corporate governance backed up by an effective internal control framework with the ability to identify key risk exposures across risk taxonomies.

Challenges faced by FIs
In the course of achieving a reasonable level of oversight, FIs find themselves facing several challenges. These challenges include a lack of:
- A systematic approach to extract, transform and standardise data
- An intuitive way for FIs to generate risk insights
- A scalable platform that can be utilised across teams.
Challenge 1: Challenging to extract, transform and standardise data
- Extracting information from a variety of data sources can be difficult and time-consuming when data is stored in many systems
- Furthermore, different data sources use different formatting, making it difficult to transform and standardise the extracted data to produce a big picture view
- Without the automatic integration of various data sources, pulling multiple graphs together requires a lot of manual effort and may be prone to human error
Challenge 2: Difficulty in generating intuitive risk insights
- The lack of a one-stop shop for risk-related data with an automatic refresh makes it difficult to generate risk trends and patterns that can showcase the amount of risk exposure that the organisation is facing
- The inability to contextualise data also affects the generation of valuable risk insights to make informed decisions
- Even if the risk is identified, it may still be difficult to know the root cause because it is not possible to slice the data across different dimensions
Challenge 3: Absence of a scalable risk monitoring platform
- Many FIs do not have a centralised platform to communicate risk-related issues
- The traditional way of transferring data across various teams results in the creation of multiple versions which may cause the spreadsheets to have discrepancies
- Given that reporting is mostly done manually, ad hoc reporting proves to be time-consuming, making it tough to make timely responses to audit or regulatory enquiries
Optimising risk oversight through the Synpulse Risk Supervisory (SRS) Framework

FIs are now able to adopt an effective risk supervision framework thanks to:
- Improvements in data storage and accessibility capabilities
- Rapid commercialisation of extraction, transformation, and load (ETL)
- Data visualisation tools
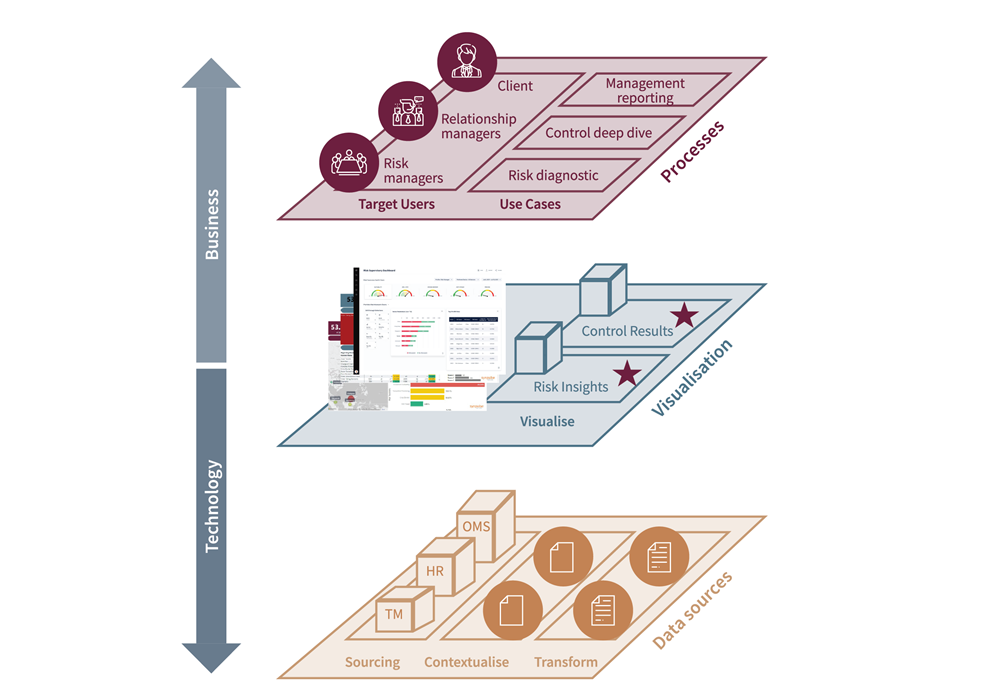
However, the adoption of such frameworks is not an easy journey for FIs, as it requires a combination of business and data knowledge. In response to such problems, Synpulse has defined the Synpulse Risk Supervisory Framework, or SRS Framework, to facilitate appropriate supervision over all key risk indicators within the bank.
The SRS Framework comprises two key building blocks:
- The Control Results Dashboard, which is mainly designed to help the management understand the rate of process adherence, or lack thereof, within the organisation.
- The Risk Insights Dashboard, which is mainly designed to indicate the level of risk exposure and identify often hidden pockets of potential risk concentration across teams and individuals.
Watch here to get a sneak peak of our Controls Results Dashboard and some sample use cases
The value of the SRS Framework
FIs are in possession of massive amounts of valuable risk-related data, but more often than not they are not able to fully realise the potential owing to the absence of an appropriate risk supervisory framework. The SRS Framework enables FIs to perform data-driven decision-making and essentially allows a paradigm shift in an FI’s operating model with respect to risk-related topics.
We understand that the implementation journey may not be that straightforward. Other challenges include the big data conundrum, where the “garbage in, garbage out” effect may end up harming FIs because it not only provides irrelevant and inaccurate information, but can also lead to wrong decision-making. Synpulse has been through these and have learnt to “boil the ocean” in iterations. With good quality data, it will take FIs from data collection to delivering business value.
In the next installment of the SRS Framework articles, we will cover the second key building block of SRS, the Risk Insights Dashboard. We’ll be elaborating how the solution helps with identification of risk concentration within the organisation and demonstrates the overall level of an FI’s risk exposure across various risk taxonomies.
1 HKMA. Supervision for Bank Culture. 19 December 2018.
2 MAS. Guidelines on individual accountability and conduct. 10 September 2020.

